003Notebook
Research Notebook
LAB-003
Structural Maturation
Reproducible
Bitcoin Grows Up
Three compressions and an index of structural age, 2009–2026
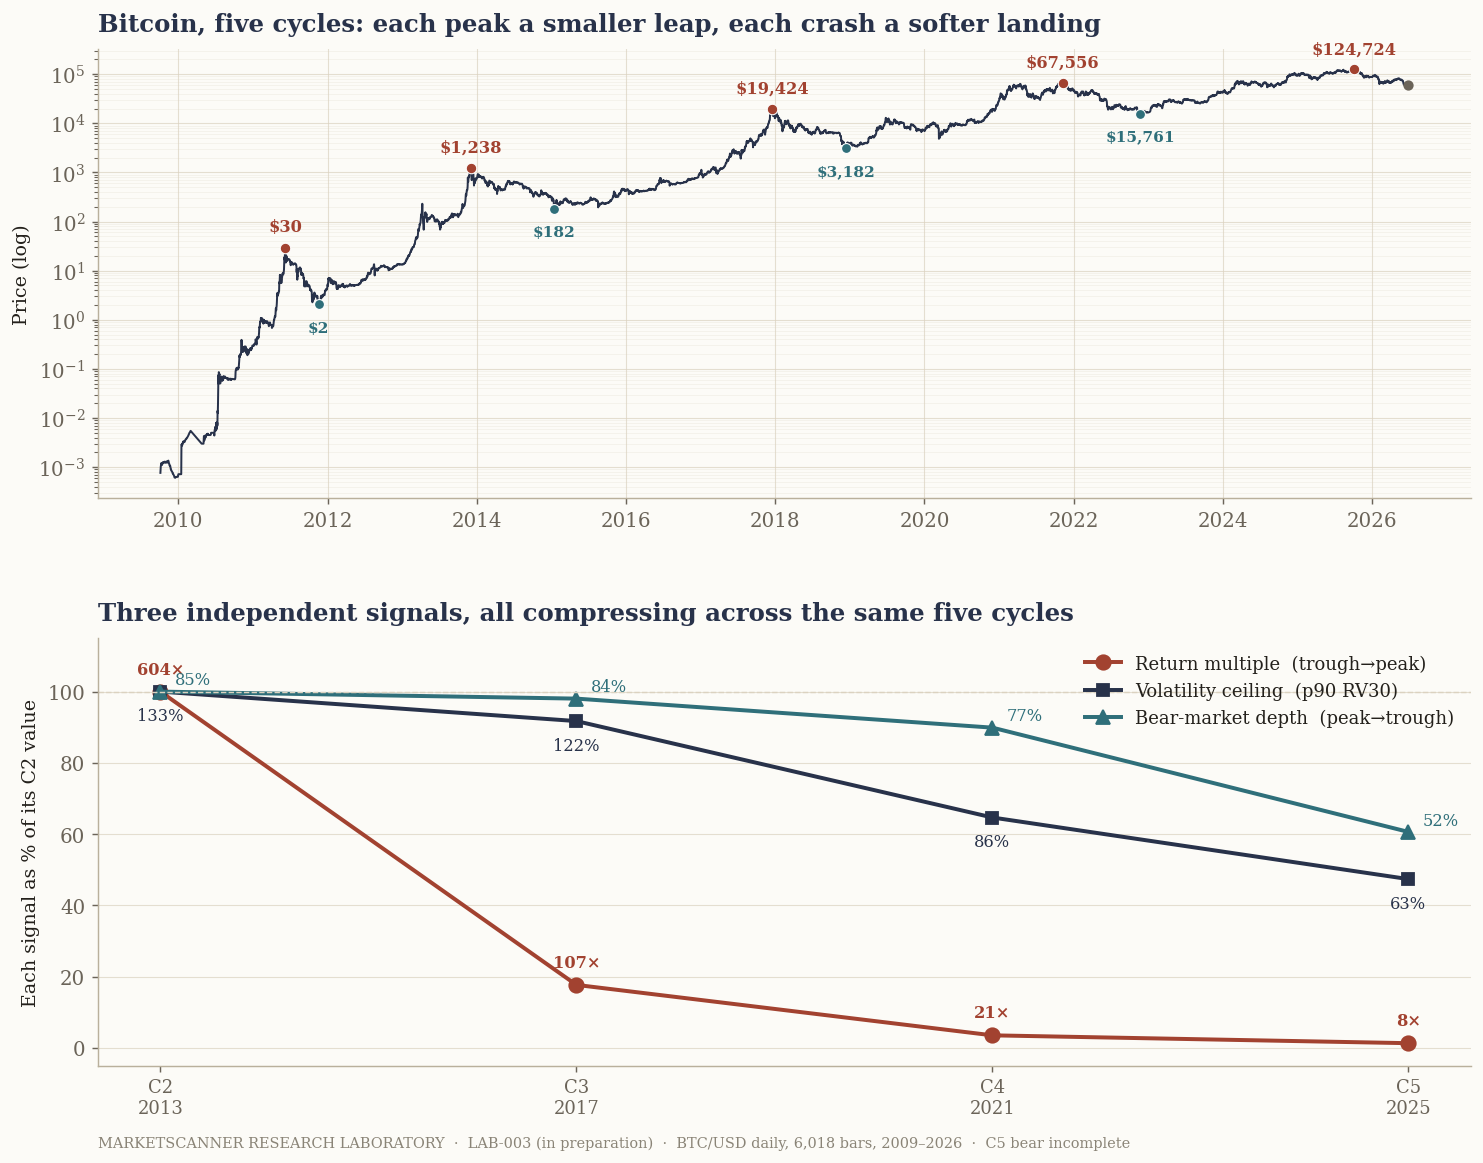
Headline findingReturn, drawdown, and volatility all compress together across five cycles — three rulers, one reading. Bitcoin is measurably maturing; a Structural Age Index now sits near 98/100.
Read Notebook 003 →
Opened Q-006 through Q-008 · one bridges to the Cycle Desk
Q-006Do the three compressions appear in gold, or are they unique to Bitcoin?Gold Study