Executive Quick-Take
In cryptocurrency market cycles, price alone is a lagging and noisy metric. Because retail hype and leverage-driven speculation frequently push price far beyond structural reality, long-term investors require a gauge of fundamental value. The MVRV Z-Score solves this by comparing market cap against the aggregate cost basis of all holders, historically pinpointing cycle tops and bottom capitulation waves with remarkable accuracy.
Understanding exactly where Bitcoin stands in its multi-year macro cycle is the holy grail for long-term investors. Buying during deep capitulations and selling when speculation is unsustainably high has historically separated top performers from the rest.
The MVRV Z-Score has historically been the most accurate on-chain indicator for identifying generational capitulation bottoms and explosive market cycle tops. Developed by on-chain pioneers David Puell and Murad Mahmudov, this metric leverages blockchain transaction records to filter out short-term speculative noise, highlighting the exact moments when Bitcoin is critically overvalued or undervalued relative to its structural foundations.
1. What is the Bitcoin MVRV Z-Score?
To understand the Z-Score, we must first break down its component metrics, which separate the daily market price of Bitcoin from its underlying transaction history:
- Market Value (Market Cap): The current exchange price of Bitcoin multiplied by the total circulating supply. This reflects the speculative spot value of the entire network.
- Realized Value (Realized Cap): Instead of valuing all coins at the current market price, Realized Cap values each UTXO (unspent transaction output) based on the price at which it last moved on-chain. This functions as an estimate of the network's aggregate cost basis, filtering out short-term trading speculative noise.
- Z-Score (Standard Deviation): A statistical normalization that measures how many standard deviations the speculative Market Cap deviates from the fundamental Realized Cap. This normalizes the data, making it comparable across different market cycle scales.
2. The Mathematical Formula
The mathematical formulation of the MVRV Z-Score is written as follows:
The division by the Standard Deviation of Market Cap is a critical mathematical detail. As Bitcoin's market capitalization has grown exponentially over the last decade (moving from a few hundred million dollars to over a trillion dollars), standard deviation acts as a logarithmic scaling tool. Without standard deviation normalization, historical comparison would be impossible because absolute differences between Market Cap and Realized Cap would dwarf early cycle data.
3. Visualizing Macro Cycles: The Model Chart
By standardizing the distance between speculative price and investor cost basis, the Z-Score identifies clear overvaluation and undervaluation thresholds. Below is the historical distribution chart of the Bitcoin MVRV Z-Score model:
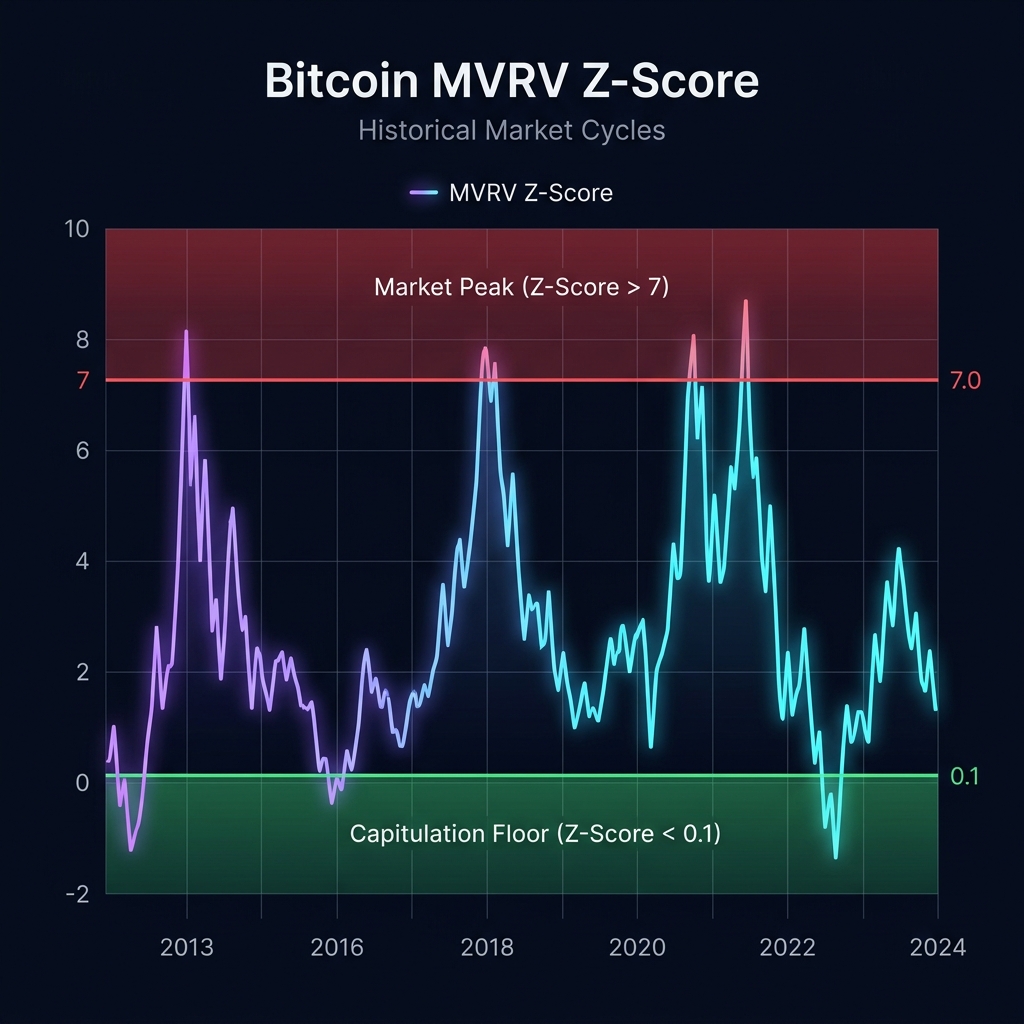 Figure 1: MarketScanner MVRV Z-Score model tracking historic overbought (Red) and capitulation (Green) regions.
4. Reading the Valuation Regimes
The Overbought Regime (Z-Score > 7.0–8.0)
When the Z-Score enters the red zone, the speculative value of Bitcoin has stretched to extreme levels compared to the network's cost basis. It represents extreme market greed and historic overvaluation. In previous epochs, entering this zone has marked the final days of the bull market:
- 2013 Peak: Z-Score reached 8.2, signaling the top of the parabolic expansion.
- 2017 Peak: Z-Score touched 7.8, warning of the incoming bear market.
- 2021 Peak: Z-Score peaked at 8.6 in early 2021 before a structural trend shift.
The Capitulation Regime (Z-Score < 0.1)
Conversely, when the Z-Score falls into the green zone, the speculative premium has evaporated. Bitcoin's spot price is trading near or below the average price at which coins last moved. This represents absolute capitulation and maximal investor pain, historically flagging generational buying zones:
- 2015 Bottom: Z-Score bottomed at -0.15, marking the start of a multi-year accumulation phase.
- 2018 Bottom: Z-Score touched -0.05 during the final capitulation wave of the bear market.
- 2022 Bottom: Z-Score fell to -0.18 following the FTX liquidity collapse.
5. Historical Cycle Performance
The historical accuracy of the MVRV Z-Score is demonstrated in the table below, which compares cycle extrema to the corresponding Z-Score readings:
| Cycle Phase | Macro Date | Peak / Floor Price | MVRV Z-Score | Market State |
|---|---|---|---|---|
| 2013 Cycle Top | November 2013 | $1,160 | 8.20 | Extreme Overvaluation |
| 2015 Cycle Bottom | January 2015 | $164 | -0.15 | Generational Accumulation |
| 2017 Cycle Top | December 2017 | $19,640 | 7.80 | Extreme Overvaluation |
| 2018 Cycle Bottom | December 2018 | $3,120 | -0.05 | Generational Accumulation |
| 2021 Cycle Top | April 2021 | $64,890 | 8.60 | Extreme Overvaluation |
| 2022 Cycle Bottom | November 2022 | $15,470 | -0.18 | Generational Accumulation |
6. Advanced On-Chain Derivatives: STH-MVRV and LTH-MVRV
To improve the fidelity of the raw MVRV Z-Score, modern analysts separate the blockchain into participant cohorts:
Short-Term Holder MVRV (STH-MVRV) focuses on coins that have moved within the last 155 days. These coins are statistically held by retail traders and momentum speculators. When STH-MVRV rises rapidly, it signals short-term FOMO, whereas when it drops below 1.0, it denotes short-term holder capitulation.
Long-Term Holder MVRV (LTH-MVRV) tracks coins dormant for longer than 155 days. This cohort represents smart money and institutional accumulators. LTH-MVRV is highly useful for identifying structural accumulation tops (where smart money is heavily distributing) and bottoms (where they are hodling through maximum distress).
7. The 2026 Shift: The ETF Era and the Institutional Floor
Following the cycle peak of $126,200 in October 2025, the MVRV Z-Score has corrected steadily. This reset indicates that speculative retail froth has been fully removed from the market, returning the indicator to undervaluation territory.
However, the core debate for 2026 is whether the institutional floor (driven by spot ETFs and corporate treasury allocations) will hold the Z-Score above the green zone, or if a final capitulation flush is required to establish the macro bottom.
Because spot ETFs and corporate treasury allocations (e.g., MicroStrategy) absorb massive circulating supply, the traditional "capitulation" bottom is evolving. When large pools of capital buy and hold Bitcoin as a treasury asset, they establish a higher structural cost basis, which prevents the MVRV Z-Score from reaching negative levels during corrections. Consequently, cycle bottoms in this era are likely to form at higher realized thresholds than historical models predict.
8. Safeguarding the Trader's Edge: The MarketScanner Sentiment HUD
While the raw, public MVRV Z-Score is a powerful directional anchor, it remains a lagging on-chain metric. To capture real-time market shifts before they reflect on-chain, the MarketScanner Sentiment HUD overlays the Z-score with order book liquidity flows, derivative funding rates, and moving average momentum structures.
Notice: To safeguard our members' edge, the exact weighting parameters, smoothing filters, and derivative overlay inputs of the MarketScanner Sentiment engine are kept private. The live indicators and real-time alerts are updated daily on the subscriber dashboard.
Frequently Asked Questions
Get the next Macro Cycle Update
Join our mailing list to receive immediate alerts when our Bitcoin tops, bottoms, and halving power-law models adjust. Free, direct, and zero spam.